

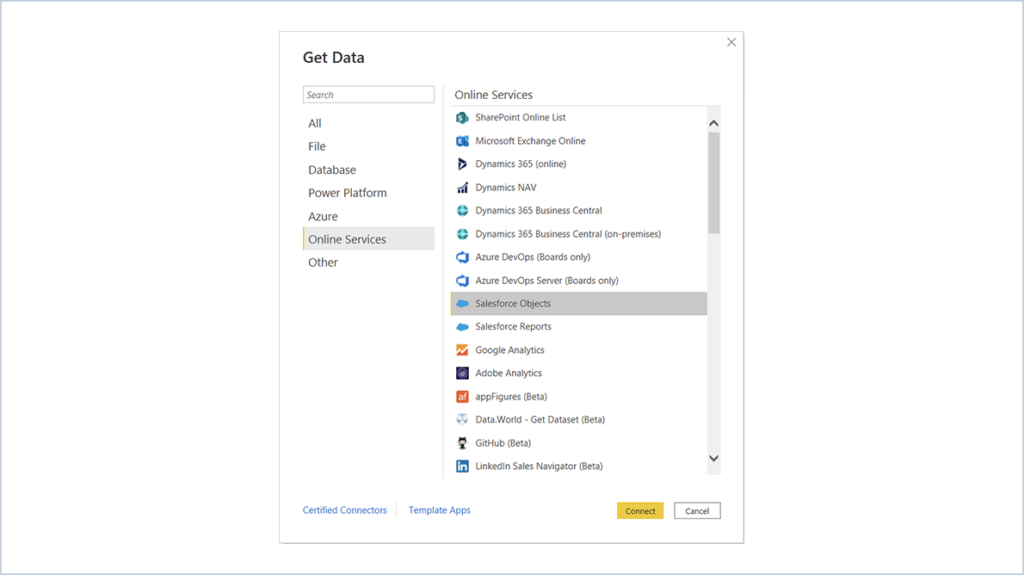
Step 1 : Click on “Get Data” in Power BI Desktop and Go to Online Services
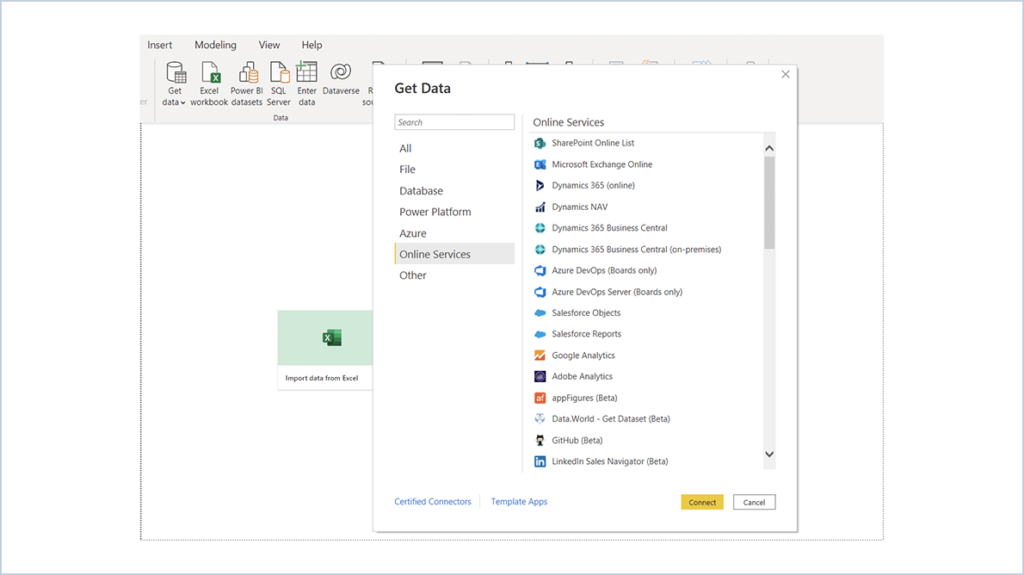
You can now select Salesforce Reports or Objects from the list.
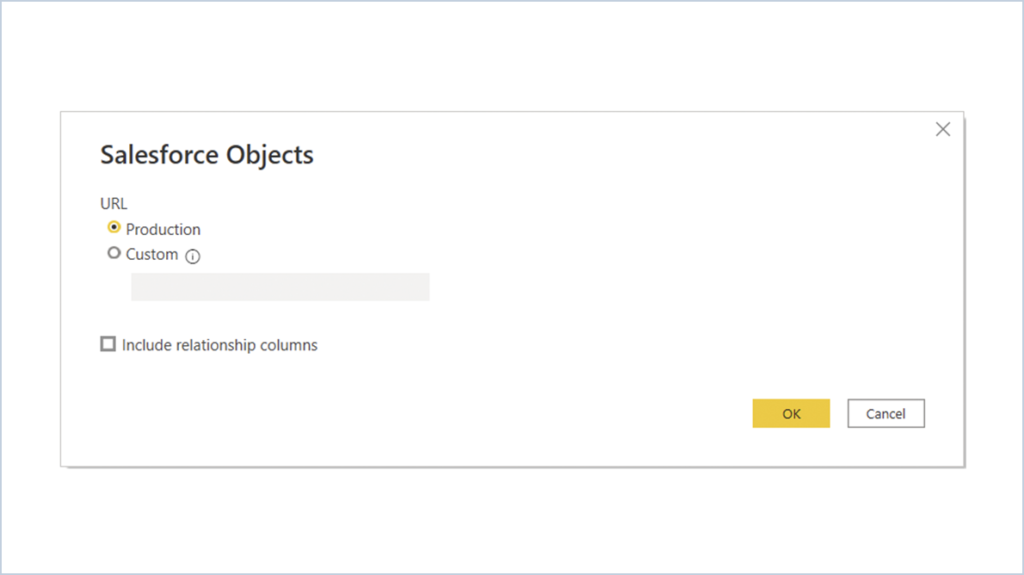
Step 2 : Select Salesforce Object and Click on Connect
Step 3: It will show the URL Selection,You can Connect production or Custom,Select Production and
Click OK.
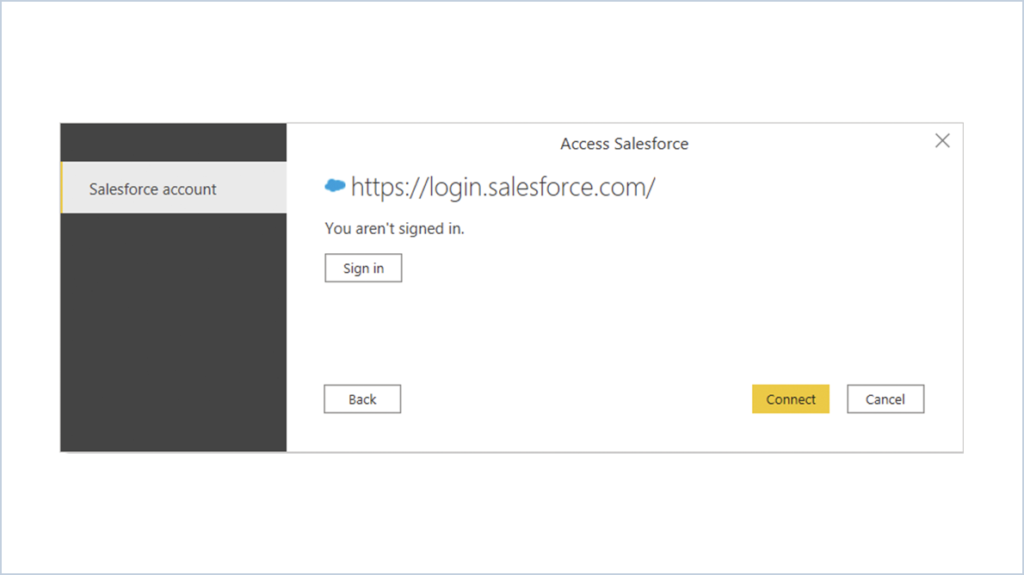
Step 4: It will ask for access to the Salesforce, Click on the Sign in.
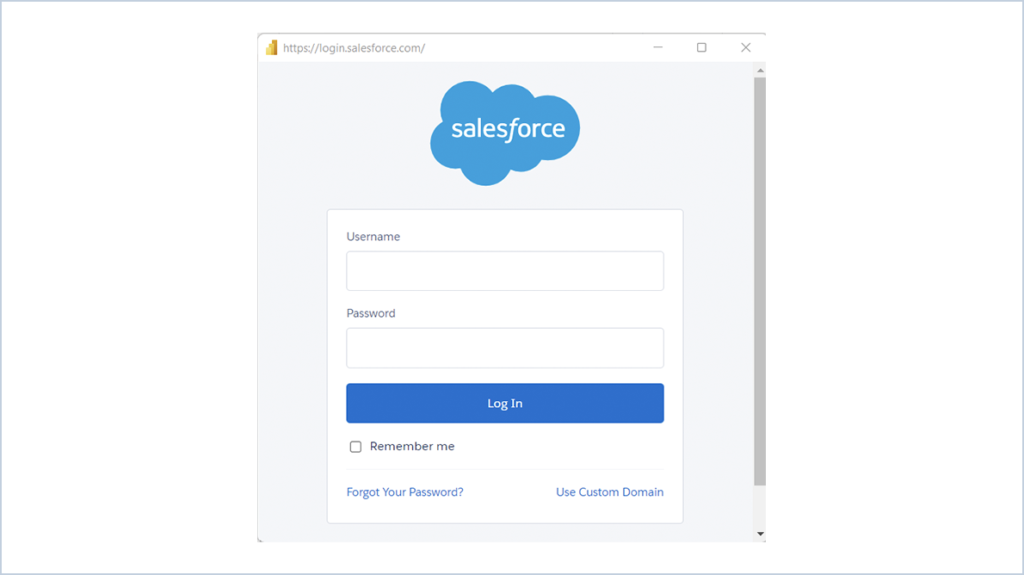
Enter credentials and click login
Step 5: After login you can see list of objects from Salesforce and select required Object to load.
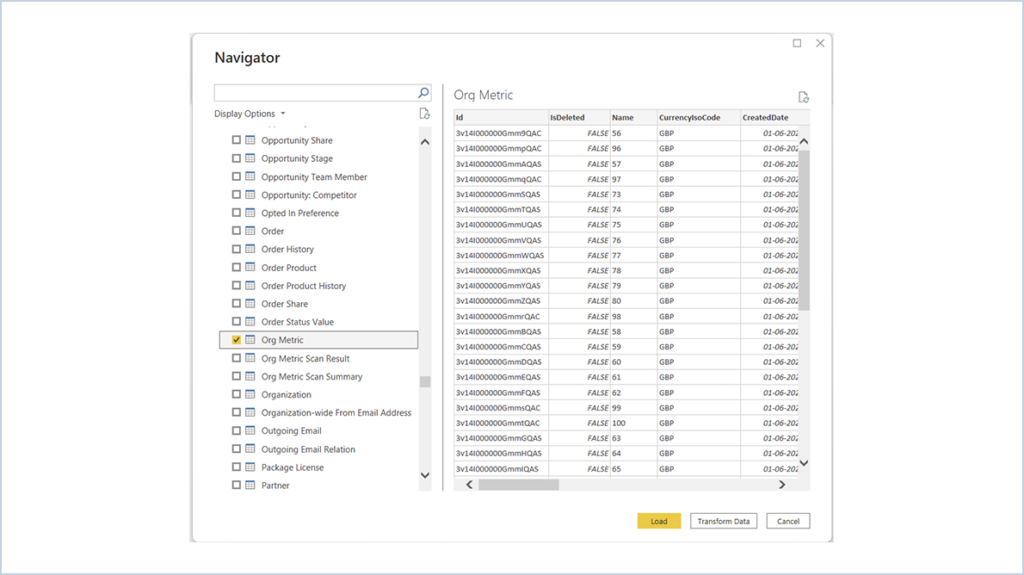
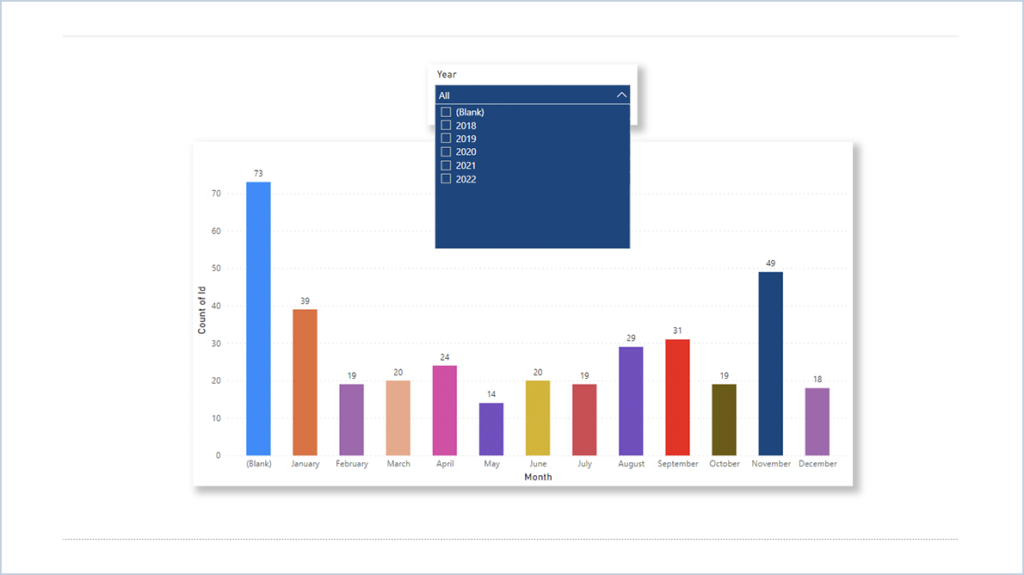
Sample PowerBI Report:
Step 1:
Loaded Project Object in to the PowerBI:
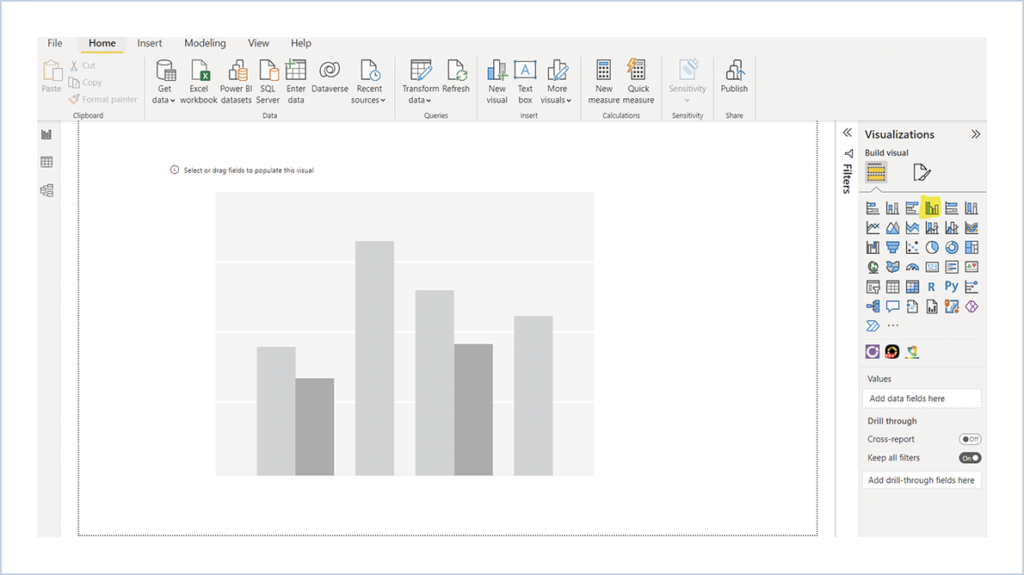
Step 2:
Drag and drop the Clustered Column chart on the Visual page:
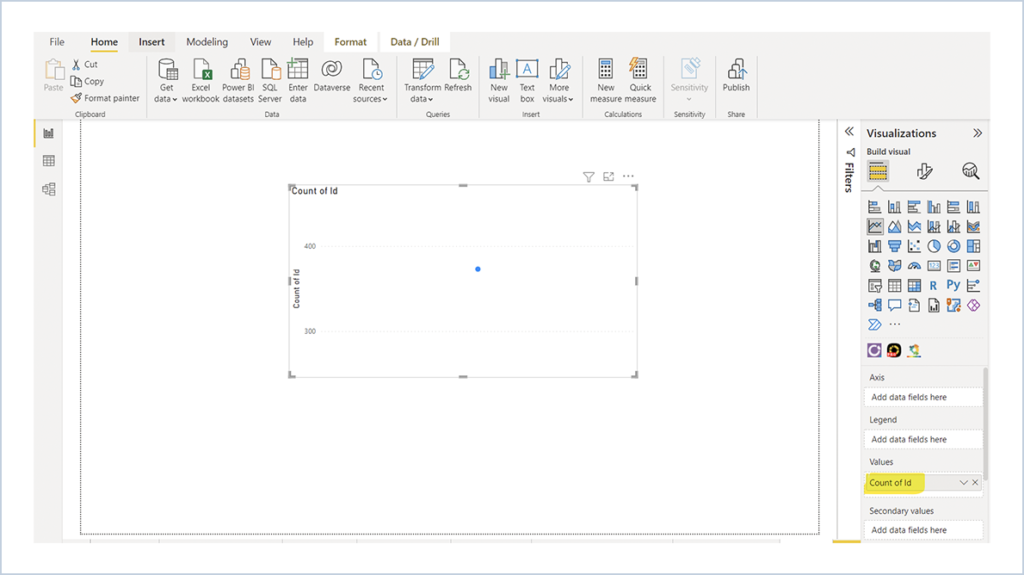
Step 3: Drop ID from Project object to the Values field on Visualizations tools.
Step 4: Add Date Field into the Axis and Format the chart in visual format.
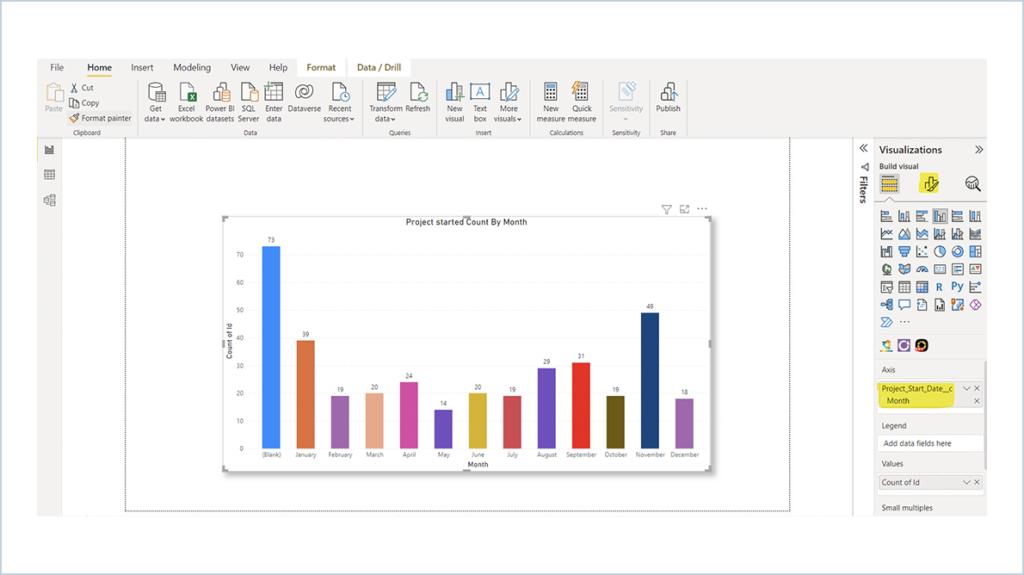
Step 5: Drop slicer from visuals and add Year field on that
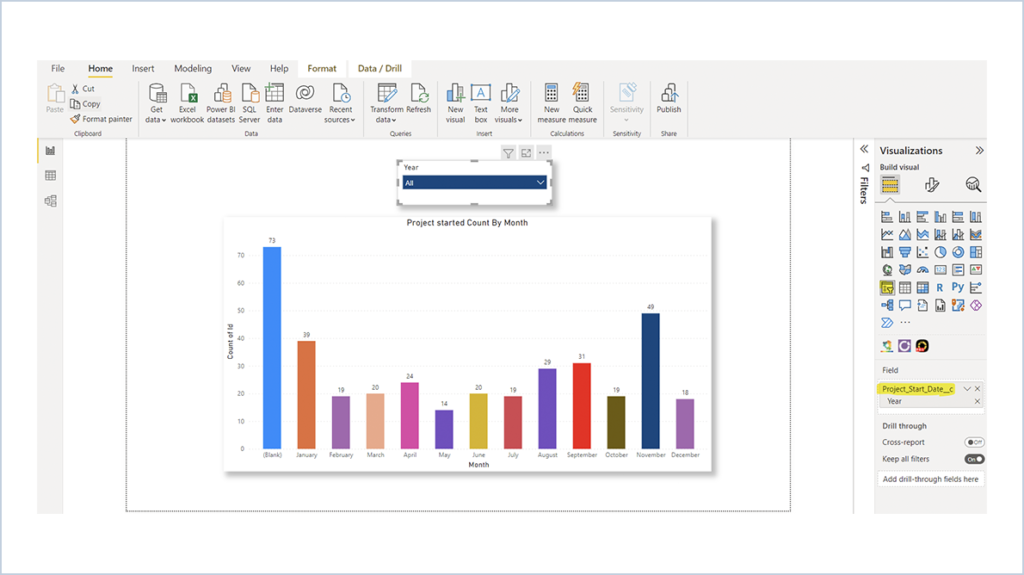
Now You can see the Number of projects started by Month in filtered Year.