

Being a web standard, data visualisation is a crucial component of today’s data science era. Executives at any firm desire to see the visual depiction of the data. You can use third-party libraries like ChartJs to display charts and graphs while using Lightning web components.
Step 1: Download ChartJS CDN
- Get ChartJS’s most recent version by clicking here.
- In the static resource with the name ChartJs, upload the downloaded js file.
An open-source Javascript toolkit called ChartJS enables us to create several types of charts using the HTML 5 canvas element. This library enables us to create a straightforward, tidy, and animated chart. The benefits of utilising this library is device responsive.
Step 2: Apex Controller
Created the apex class that used the Opportunity standard object to retrieve the aggregate data for each Stage.
public without sharing class OpportunityController {
    @AuraEnabled(cacheable=true)
    public static List<DataSet> getAllOppsByStage(){
        List<AggregateResult> result =  [SELECT Count(Id) cnt, StageName FROM   Opportunity GROUP BY StageName];
        List<DataSet> dataSet = new List<DataSet>();
        for(AggregateResult ar : result) {
            String stage =  (String)ar.get('StageName') ;
            Integer total =  (Integer)ar.get('cnt');
            dataSet.add(new DataSet(stage ,total));
        }
        return dataSet ;
    }

    public class DataSet {
        public DataSet(String label ,Integer count){
            this.label  = label ;
            this.count  = count ;
        }

        @AuraEnabled
        public String label {get;set;}
        @AuraEnabled
        public Integer  count {get;set;}
    }
}
Step 3: Lightning Web Component
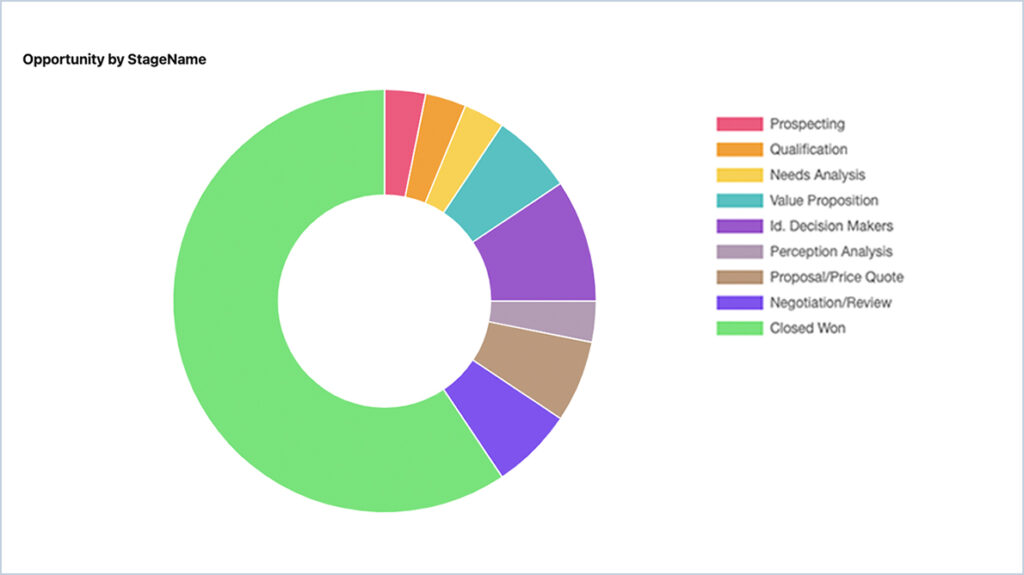
Component to display the StageName for all opportunities and the number of deals we currently have for each step.
JavaScript :
It includes three main things
- type : It specifies the type of chart that is being rendered
- data : The chart labels, chart data, and other bar chart parameters are passed here.
- options : further Charts settings.
import { LightningElement, api, wire } from 'lwc';
//importing the Chart library from Static resources
import chartjs from '@salesforce/resourceUrl/ChartJs';
import { loadScript } from 'lightning/platformResourceLoader';
import { ShowToastEvent } from 'lightning/platformShowToastEvent';//importing the apex method.
import getAllOppsByStage from '@salesforce/apex/OpportunityController.getAllOppsByStage';

export default class OpportunityStage extends LightningElement {
    @wire (getAllOppsByStage)
    opportunities({error,data}) {
        if(data) {
            for(var key in data) {
                this.updateChart(data[key].count,data[key].label);
            }
            this.error=undefined;
        }
        else if(error) {
            this.error = error;
            this.opportunities = undefined;
        }
    }
    chart;
    chartjsInitialized = false;
    config={
        type : 'doughnut',
        data :{
            datasets :[
            {
                data: [],
                backgroundColor :[
                    'rgb(255,99,132)',
                    'rgb(255,159,64)',
                    'rgb(255,205,86)',
                    'rgb(75,192,192)',
                    'rgb(153,102,204)',
                    'rgb(179,158,181)',
                    'rgb(188,152,126)',
                    'rgb(123,104,238)',
                    'rgb(119,221,119)',],
                label:'Dataset 1'
            }
             ],
        labels:[]
        },
        options: {
            responsive : true,
            legend : {
                position :'right'
            },
            animation:{
                animateScale: true,
                animateRotate : true
            }
        }
    };

    renderedCallback() {
        if(this.chartjsInitialized) {
            return;
        }
        this.chartjsInitialized = true;
        Promise.all([
            loadScript(this,chartjs)
            ]).then(() =>{
                const ctx = this.template.querySelector('canvas.donut')
                .getContext('2d');
                this.chart = new window.Chart(ctx, this.config);
            })
            .catch(error =>{
                this.dispatchEvent(
                    new ShowToastEvent({
                        title : 'Error loading ChartJS',
                        message : error.message,
                        variant : 'error',
                }),
            );
        });
    }

    updateChart(count,label){
        this.chart.data.labels.push(label);
        this.chart.data.datasets.forEach((dataset) => {
            dataset.data.push(count);
        });
        this.chart.update();
    }
}
HTML :
HTML5 canvas is a single DOM element that gives us a way to draw shapes on a node’s space using its provided drawing interface and methods.
<template>
    <lightning-card title='Opportunity Stage Chart'>
        <div class="slds-box slds-theme_inverse custom-background">
            <canvas class="donut" lwc:dom="manual"></canvas>
        </div>
    </lightning-card>
</template>
XML :
To make the component accessible to the app builder, the home or detail pages, the tab and the community page.
<?xml version="1.0" encoding="UTF-8"?>
<LightningComponentBundle xmlns="http://soap.sforce.com/2006/04/metadata">
    <apiVersion>55.0</apiVersion>
    <isExposed>true</isExposed>
    <targets>
        <target>lightning__RecordPage</target>
        <target>lightning__AppPage</target>
        <target>lightning__HomePage</target>
        <target>lightning__Tab</target>
    	<target>lightningCommunity__Page</target>
    </targets>
</LightningComponentBundle>
Component View :